
A work visibility tracking framework
Or how to figure out your ongoing tech debt costs in a way the CFO loves

Today’s topic
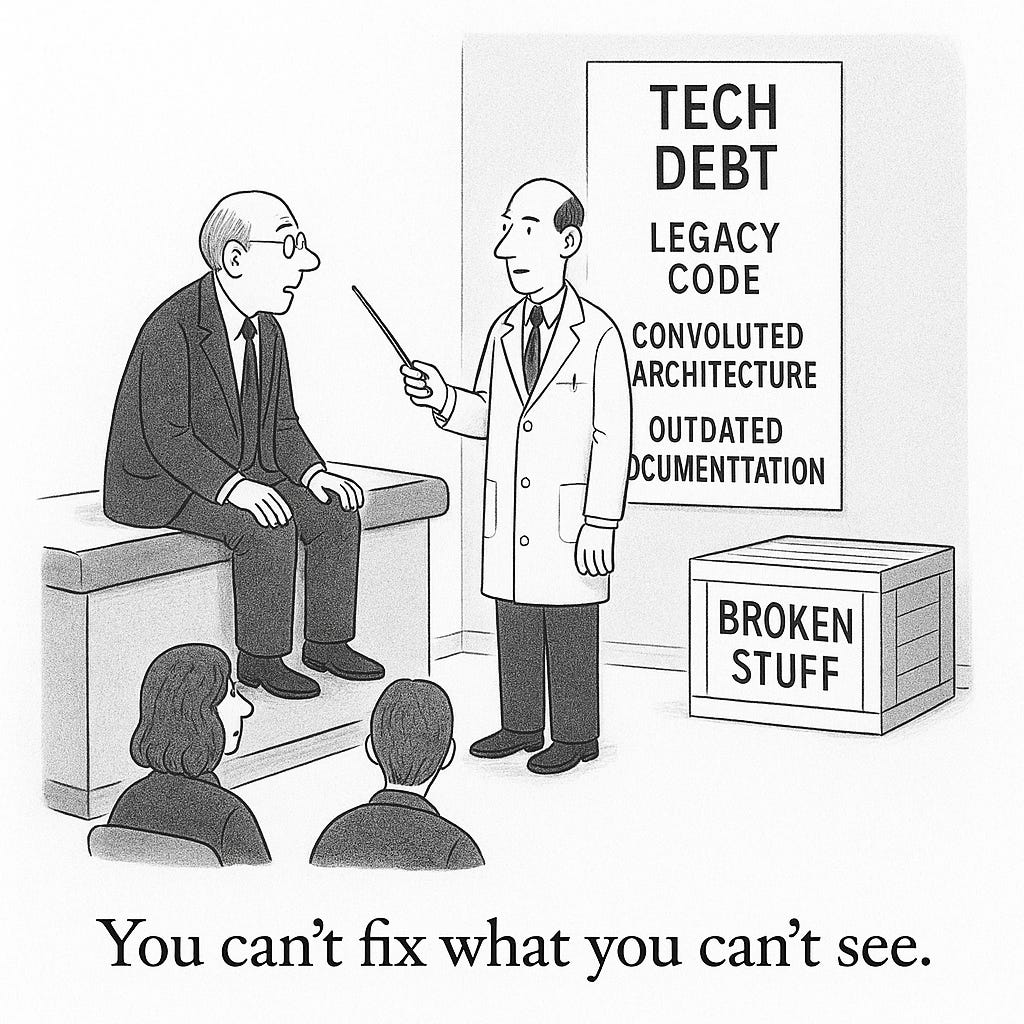
A while ago I wrote an article about treating tech debt less as a moral failing, nor a “debt” issue, but instead as a throughput one. Some folks reached out to share the framework had been useful to them.
I also know the original article it was a bit long for some folks. Today I wanted to pull out a functional piece of that post for those with shorter attention spans. I’m not judging, I’m meeting you where you are. 😉
This article will zero in on making the work of your engineering team visible, and to an extent countable. Yeah - I’m aware of the DORA approach which has some great measures of inputs to velocity. But when you’re wondering “what are the types of work we do?” and “how much are we doing of each?” - this is the post for you.
I nice side benefit is that the non-engineering executives you work with are always wondering about this even if they aren’t asking. Trust me - I’m pretty sure. Proactively having even a swag at this on a regular basis is likely to make your resourcing conversations go much smoother.
What is slowing us down is what we’re doing - so what is that?
At the root cause level what tends to slow things down are likely in one of these three buckets;
Lack of clarity/vision (impacting motivation and focus) - ie; you’re not only working on this thing that drives outsized customer/business value. It’s hard to make great progress without this. I have a primer to start with from a few moons ago.
Lots of multitasking. Read Goldratt’s Rules of Flow and checkout my prior post to ensure your Agile-like process is helping and not hurting. If you don’t want to read these check if you’ve got 6 devs in a sprint and 8 things going on, plus a “product owner” that wants to get every drop of juice out of every sprint. If you’re wondering how I knew that then go read the other two things. Please.
Significant amounts of time that isn’t on either new customer value or being able to build faster. Maybe people are a bit vague about this - or often list things like “dependency updates” in what’s a drag on velocity. This is the throughput point I’ll hone in on below.
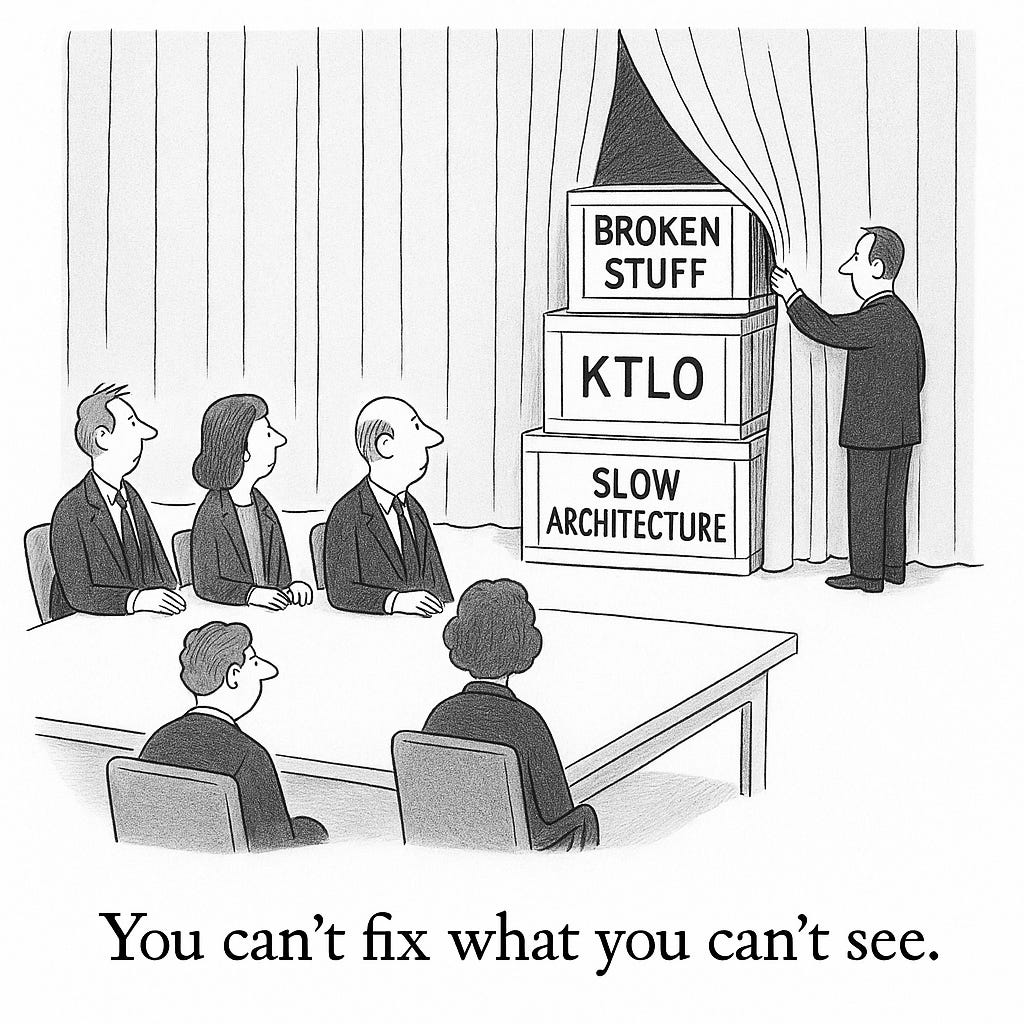
A types of work histogram
At a tactical level, most teams can build a histogram of where time goes using the following buckets
Broken stuff: Things you were interrupted by because they broke - or people thought they might be broken (think questions about the prices from your pricing system).
KTLO (Keeping the lights on activity) - Time you had to take just to keep things running (package/dependency updates, compliance updates, answering questions about your poorly documented API etc) - also could include those pesky pricing questions depending on how you bucket things.
Dealing with coupling: Time spent on dependency discussions (how you organize people, systems). An example: if you cannot change your database because you’ll break other people’s stuff downstream, then you spend an inordinate amount of time discussing boring but critical changes to your tightly coupled schema. Don’t laugh - this still happens all the time.
Time spent on building new things that are slow because of your current systems/architecture. This is the roughest one to estimate - it’s more of a swag. If say you out of 10 devs spend roughly 6 of their time building, but you feel you could go 30% faster with some changes then capture that as a bucket for improvement. It’s not perfect given the next bucket - but I’m just looking for a way to highlight typical problems and opportunities.
Time invested so we can go faster or be safer in the future (better monitoring/alarming, extensibility of current architecture, toolset, CD, testing, etc).
Time building new product features
The first four bullets are drags on throughput (building new things that drive customer and business value - now and in the future), the last two are positive throughput, or increase throughput. Once you’ve refined the histogram segments with group discussion, then I recommend measuring just enough to scope the size of each bucket.
Now we’ve gone a rough sense of the types of work and time in each. So what?
At this stage you’ve found how much time is spent outside the two last categories (going faster in the future, building stuff we want now). Evaluate if there’s enough drag to care about changing right now. There may not be - or it may make more sense for any number of reasons to work on them later. If you’ve made that call at this stage you likely built enough shared context and trust for everyone to understand the decision, and feel heard.
If you do decide that there’s benefit in reducing the drag on throughput - then congrats - you’re about to pay down some technical debt! Focus on finding the biggest constraint on your throughput and what things that you control can be changed to make it better. Most systems have key constraints to throughput that once identified allow you to have disproportionate benefits. This is often referred to as the Pareto principle that suggests there exists 20% of work that can drive 80% of improvement.
If you take only one thing away from this:
High confidence bets that free up people or lets us build our roadmap hugely faster should generally not be ignored. Every person you take off perpetual oncall makes people happier and is equivalent to hiring another teammate.
There’s no magic formula. Figuring out what investment to bet on requires getting into the weeds. If you do something a lot and it sucks then fixing it will have a lot of yield. If things break all the time and trust/customers are hemorrhaging then you probably don’t need to overthink whether you fix stuff. Tech debt costs time later (and integrates), not making customers thrilled now can make a recovery harder or impossible, and fearless/joyful building lets us win in the longer term. Thinking in a truly 360 degree manner like most things requires accepting complexity and getting people to share the same context.
Want to go a step deeper in how to use these measurements - just checkout the longer form version of this post.